As part of our efforts to contribute to a net-zero carbon economy, Mirae Asset Securities is strengthening our company-wide environmental data management and transition finance practices in line with international standards. Through responsible investment and the adoption of eco-friendly management practices, we aim to drive sustainable growth and development.
Environmental
Management Practices
We enhance the environmental awareness of our employees through company-wide environmental management, while also endeavoring to fulfill our environmental impact to reduce greenhouse gas (GHG) emissions, energy consumption, and waste generation by encouraging employees to participate in various environmental campaigns and initiatives that support sustainable development. Specifically, we measure Scope 1, 2, and 3 emissions and systematically manage GHG emission, waste generation, and energy consumption data across the organization. We also report our climate change responses to the Carbon Disclosure Project (CDP) as part of our active participation in global efforts to address climate change. Moreover, we are strongly committed to expanding carbon reduction finance to contribute to Korea’s goal of achieving net-zero emissions by 2050. To this end, we have set a sustainable finance goal of KRW 45 trillion by 2025.
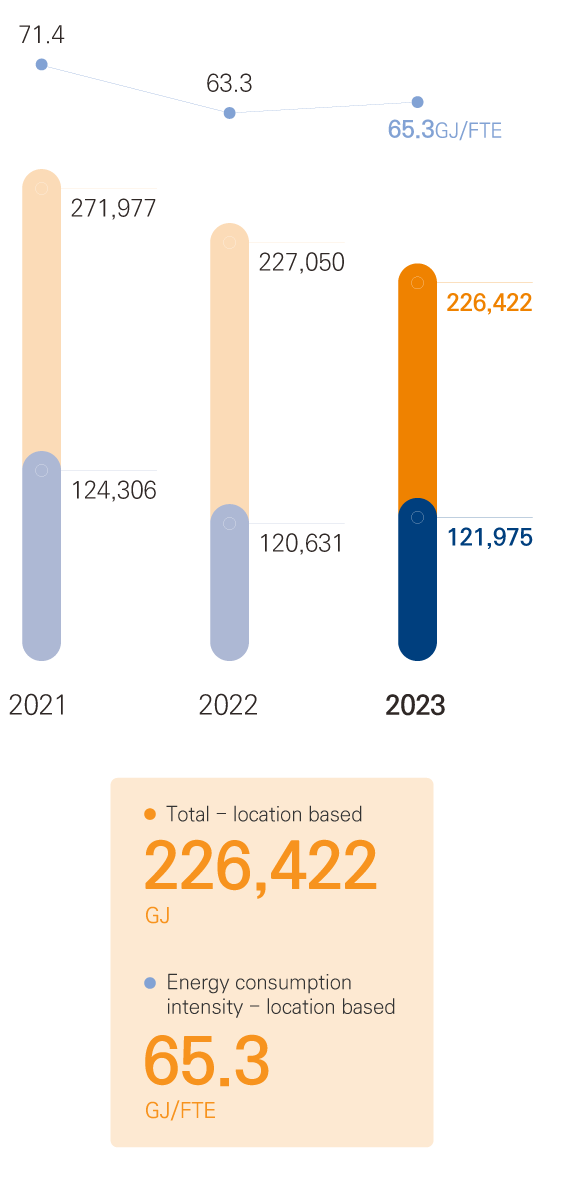
Controlling GHG
emissions and energy
consumption
Scope 1 (direct GHG emissions) &Scope 2 (indirect GHG emissions)
GJ/FTE
Energy consumption intensity
ton CO2eq/FTE
GHG emission intensity
We have been reducing unnecessary energy usage and implementing continuous controls to efficiently reduce energy consumption and GHG emissions. Given the nature of the financial industry, there are almost zero direct GHG emissions caused by energy sources directly owned or managed by Mirae Asset Securities.
We, therefore, focus on controlling Scope 2 (indirect) emissions generated from our owned and leased properties.
GHG Footprint
-
Energy consumption
-
GHG emission
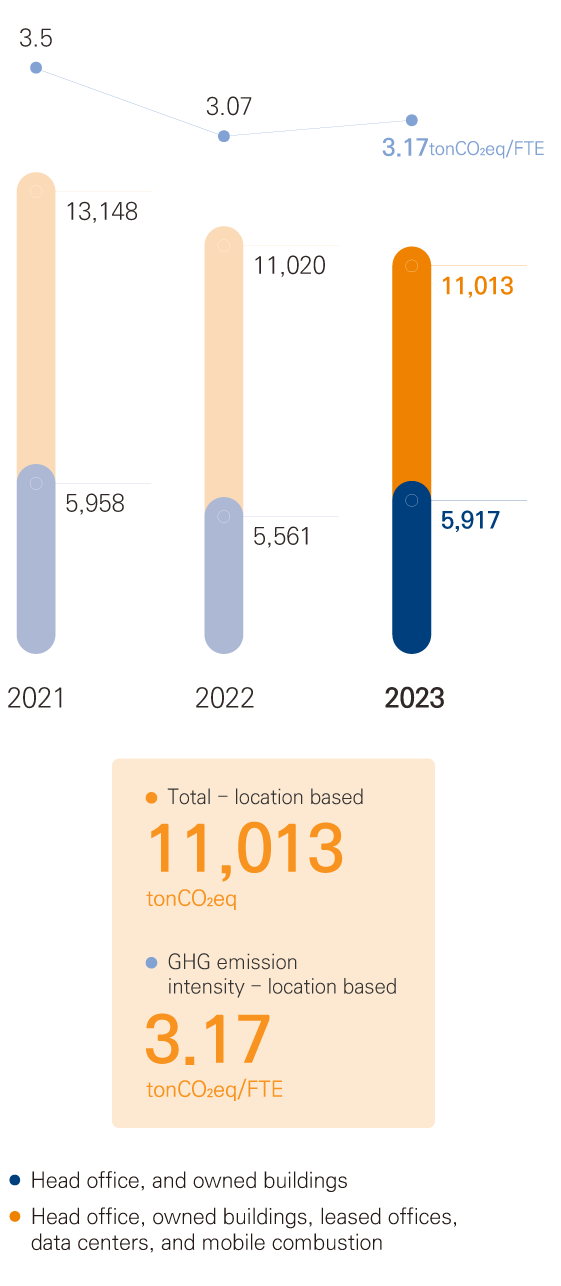
- Total GHG emissions and GHG emissions intensity are based on Scope 1 and Scope 2
Controlling water, resource, and waste generation
Scope 3 (other indirect GHG emissions)
m3/FTE
Water consumption intensity
We have a control system in place for wastewater and rainwater treatment. To minimize its environmental impact, the Mirae Asset Center One Building has its own facility to treat wastewater for reuse in toilet flushing and landscape irrigation.
In addition, we voluntarily account for and control Scope 3 emissions generated by indirect emission activities such as business travel, paper use, and waste disposal.
Environmental
performance
| Category | Coverage | 2023 | 2022 | 2021 | 2020 | 2019 | |
|---|---|---|---|---|---|---|---|
|
Energy consumption (Unit: GJ) |
Energy consumption | Head office, owned buildings | 121,975 | 120,631 | 124,306 | 117,692 | 226,658 |
| Leased offices, data centers, mobile combustion | 104,447 | 106,419 | 147,671 | 174,472 | - | ||
| Fuel (LNG, diesel, Kerosene) | Head office, owned buildings | 9,377 | 9,814 | 9,354 | 8,995 | 17,823 | |
| Mobile combustion | All | 8,436 | 7,490 | 6,960 | 7,855 | - | |
| Electricity | Head office, owned buildings | 111,672 | 104,982 | 113,493 | 108,697 | 208,835 | |
| Leased offices, data centers | 95,180 | 103,009 | 139,753 | 150,450 | - | ||
| District heating | Head office, owned buildings | 926 | 1,020 | 1,459 | - | - | |
| Leased offices, data centers | 831 | 735 | 958 | 16,167 | - | ||
| Renewable energy consumption | - | 29,376 | 5 | 5 | 173 | - | |
|
Greenhouse gas(GHG) emissions (Unit : tonCO2eq) |
Scope 1 | Head office, owned buildings | 476 | 499 | 474 | 455 | 904 |
| All (mobile combustion) | 567 | 503 | 468 | 524 | - | ||
| Scope 2 | Head office, owned buildings | 5,378 | 5,062 | 5,484 | 5,279 | 10,143 | |
| Leased offices, data centers | 4,592 | 4,956 | 6,722 | 7,862 | - | ||
| Scope 3 | All | 549 | 384 | 116 | 315 | 1,057 | |
| Water consumption (Unit : m3) |
Tap water/sewage | Head office, owned buildings | 59,513 | 56,044 | 51,077 | 57,754 | 100,667 |
| Waste generation (Unit : Kg) |
General waste | Head office, owned buildings | 428,085 | 442,412 | 59,919 | 301,724 | 267,829 |